
You can use the Answer Bot Insights dashboard to monitor your Answer Bot activity and article effectiveness. The Answer Bot Insights dashboard can help you identify if Answer Bot is solving your support requests, how quickly users are opening suggested articles, and how your individual articles are performing.
For information on the metrics used on the Answer Bot Insights dashboard, see Answer Bot metrics reference.
Accessing the Answer Bot Insights dashboard
You can view the Answer Bot Insights dashboard directly in your agent interface. This section will instruct you on how to navigate to the dashboard. See the sections below for information on the reports available.
- Click the Reporting icon (
 ) in the sidebar.
 - Select the Insights tab.
- Ensure Insights - View Only is selected from the drop-down list on the left.

- Select the Answer Bot tab.
 Note: If you have several different Insights - View Only tabs, you might need to use the left or right arrows (>) to find the Answer Bot tab.
You will then be located on the Answer Bot Insights dashboard. For information on the Answer Bot Insights reports, refer to the sections below:
Filtering the reports to see specific channel performance
You can filter the dashboard to show metrics for each specific channel - which is really important when reviewing Answer Bot performance for Triggers and Web forms. By default, the Ticket Via shows everything. Simply selecting only web will update all dashboard reports to show the performance of Answer Bot for Web Forms.

Answer Bot headline metrics
The Answer Bot dashboard displays your most important metrics at the top of the dashboard as headline reports. Headline reports show the overall total for the selected time period, and the percentage change from the previous time period.
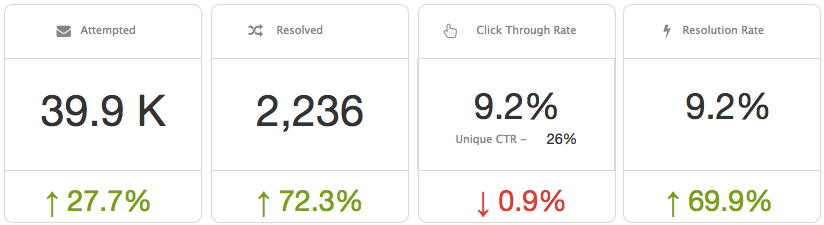
- Attempted: The number of Answer Bot responses sent.
- Resolved: The number of tickets solved using Answer Bot.
- Click Through Rate: The percentage of Answer Bot suggested articles that were clicked over the total number of Answer Bot responses sent. This does not include any time a user clicks "Not helpful."
- Unique CTR : Located directly underneath the Click Through Rate headline number. Unique CTR represents the percentage of tickets where an Answer Bot article was clicked over the total number of Answer Bot responses sent.
Note: The percentage change in this report is for the Click Through Rate headline metric.
- Resolution Rate: The percentage of tickets resolved with Answer Bot over the total number of Answer Bot responses.
Answer Bot performance by volume
Answer Bot Performance and Volume (Past 30 days) chart shows the number of responses Answer Bot sends compared to the number of tickets Answer Bot solves. This enables you to analyze how well your suggested articles are performing overall based on how many responses are being sent by date.
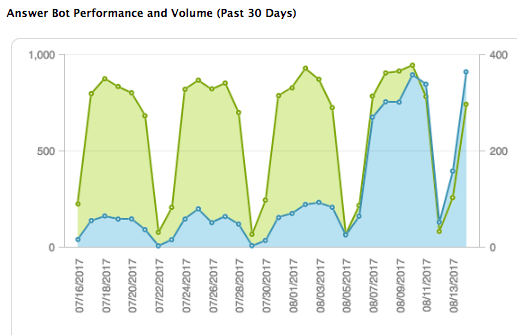
If you hover over one of the data points on the blue line, you can see the number of Answer Bot attempted resolutions, or total responses sent, on that date. If you hover over one of the data points on the green line, you can see the number of Answer Bot resolutions, or total number of tickets resolved using Answer Bot, on that date.
Answer Bot performance by time
There are two metrics that can help you measure how Answer Bot is performing. These metrics are located to the right of the Answer Bot Performance and Volume chart and can help you identify how quickly your suggested articles are helping your users.
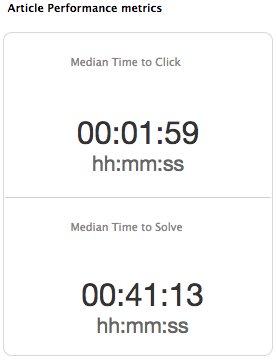
- Median Time to Click: The median number of hours, minutes, and seconds between Answer Bot suggesting an answer and the customer clicking on one of the articles.
- Median Time to Solved: The median number of hours, minutes, and seconds between Answer Bot suggesting an answer and the customer confirming their ticket as solved.
These metrics can help you analyze how well customers are responding to Answer Bot. For example if there is a large gap of time between when a customer clicked an article and when it was marked as resolved, your customers might be having difficulties finding the answers to their questions in your articles.
Article performance
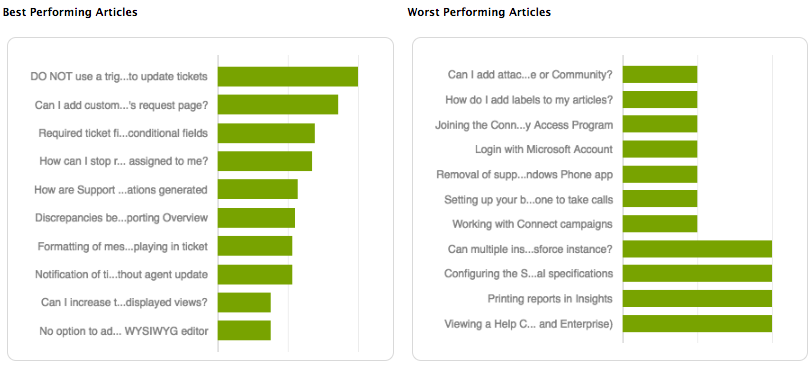
While the charts above can help you measure your Answer Bot overall performance, there are two charts at the bottom of your dashboard that can help you analyze individual articles.
- Best Performing Articles: The number of articles with the highest ratio of times the article solved a customer's support request over times the article was included in Answer bot responses.
- Worst Performing Articles: The number of articles with the lowest ratio of times the article solved a customer's support request over times the article was included in Answer Bot responses.
Comments
0 comments
Please sign in to leave a comment.